

Estimating and validating treatment effects for binary outcomes
Source:vignettes/Binary-examples.Rmd
Binary-examples.RmdThis vignette follows a treatment-effect analysis from a simple comparison to an adjusted average treatment effect (ATE), conditional average treatment effect (CATE) scores, and validation in held-out data. The data are entirely synthetic. For an introduction to individualized treatment effect prediction with binary endpoints in randomized trials, see Hoogland et al. (2021). See the count example for the corresponding analysis of relapse rates and repeated cross-validation.
Example data
We simulate counts of relapses during one year using the same
data-generating model as simulate_count(). The outcome is
y = 1 if a patient has at least one relapse and
y = 0 otherwise. The underlying count is retained in
relapse_count. Everyone has the same follow-up, and the
outcome is fully observed. Set threshold to a larger
integer to define an event as more than that many relapses, or change
followup to study another fixed horizon.
binaryExample <- simulate_binary(n = 4000, seed = 2026,
                                 followup = 1, threshold = 0)
head(binaryExample)
#>           age female previous_treatment previous_cost previous_number_symptoms
#> 1   4.6853017      0              drugB   -0.04071778                        0
#> 2  -9.7172169      1              drugB   -0.07763572                      >=2
#> 3   1.2531430      1              drugA    0.38461438                        0
#> 4  -0.7627391      1              drugB   -0.45026280                        0
#> 5  -5.9997565      0              drugC    0.55030741                        1
#> 6 -22.6448013      1              drugB   -0.59281629                        1
#>   previous_number_relapses   trt y years relapse_count
#> 1                        0 drug1 1     1             1
#> 2                        0 drug0 1     1             1
#> 3                        0 drug1 1     1             1
#> 4                        0 drug1 0     1             0
#> 5                        1 drug1 1     1             2
#> 6                        1 drug0 0     1             0
table(binaryExample$trt, binaryExample$y)
#>
#>            0    1
#>   drug0 1003  855
#>   drug1 1273  869
prop.table(table(binaryExample$trt, binaryExample$y), margin = 1)
#>
#>                 0         1
#>   drug0 0.5398278 0.4601722
#>   drug1 0.5943044 0.4056956
Treatment is assigned using age and previous treatment, so the treatment groups need not be comparable without adjustment. Age is centered at 48 years and previous cost is centered at 13,824 USD and divided by 20,172 USD. The simulation coefficients are illustrative and are not clinical estimates. Unlike a count rate ratio, the relapse risk difference depends on the selected threshold and follow-up period.
Estimate the average treatment effect
For the estimators and their assumptions, see Methods for estimating average treatment effects.
Unadjusted treatment comparison
We first compare the observed relapse proportions under drug1 and drug0.
relapse_risks <- with(binaryExample, tapply(y, trt, mean))
relapse_risks
#>     drug0     drug1
#> 0.4601722 0.4056956
The unadjusted risk difference for drug1 versus drug0 is calculated by subtracting the relapse proportion for drug0 from that for drug1. A negative value means a lower observed relapse proportion under drug1. Here, the unadjusted risk difference is -0.054, or -5.4 percentage points for drug1 minus drug0. This unadjusted comparison may reflect baseline differences between the groups rather than a genuine treatment effect.
The 95% confidence interval is -0.085 to -0.024, based on a normal approximation for two independent proportions.
Covariate-adjusted treatment comparison
Treatment assignment may differ according to baseline characteristics. We fit a multivariable binomial model adjusting for age, sex, previous treatment, previous medical cost, and previous relapses, as in the count example. The identity link estimates the risk difference directly (Naimi and Whitcomb 2020).
adjusted <- glm(
  y ~ trt + age + female + previous_treatment + previous_cost +
    previous_number_relapses,
  data = binaryExample, family = binomial(link = "identity")
)
summary(adjusted)
#>
#> Call:
#> glm(formula = y ~ trt + age + female + previous_treatment + previous_cost +
#>     previous_number_relapses, family = binomial(link = "identity"),
#>     data = binaryExample)
#>
#> Coefficients:
#>                            Estimate Std. Error z value Pr(>|z|)
#> (Intercept)               0.4296033  0.0204141  21.044  < 2e-16 ***
#> trtdrug1                 -0.0973253  0.0170384  -5.712 1.12e-08 ***
#> age                       0.0056606  0.0009682   5.846 5.02e-09 ***
#> female                    0.0535246  0.0171345   3.124  0.00179 **
#> previous_treatmentdrugB   0.0131217  0.0176378   0.744  0.45690
#> previous_treatmentdrugC  -0.0326664  0.0205354  -1.591  0.11167
#> previous_cost             0.0398499  0.0163037   2.444  0.01452 *
#> previous_number_relapses  0.0228496  0.0087874   2.600  0.00932 **
#> ---
#> Signif. codes:  0 '***' 0.001 '**' 0.01 '*' 0.05 '.' 0.1 ' ' 1
#>
#> (Dispersion parameter for binomial family taken to be 1)
#>
#>     Null deviance: 5468.8  on 3999  degrees of freedom
#> Residual deviance: 5397.6  on 3992  degrees of freedom
#> AIC: 5413.6
#>
#> Number of Fisher Scoring iterations: 3
The adjusted risk difference for drug1 versus drug0 is captured by
the coefficient for trtdrug1 and estimated as -0.097 (95%
CI: -0.131 to -0.064). The interval is a model-based Wald interval. The
model assumes that the risk difference is the same at every covariate
value; under this assumption, the coefficient is also the risk
difference averaged over the study population. A causal interpretation
requires, among other assumptions, a correctly specified outcome model,
no unmeasured confounding, and adequate treatment overlap.
Population-level treatment comparison using
atefit()
atefit(response = "binary") estimates the difference in
relapse probability under drug1 and drug0. Negative values favor drug1
because relapse is an adverse outcome. The estimator combines a logistic
outcome model and a treatment model (the propensity-score model), which
estimates the probability of receiving treatment 1 given the covariates.
Under the usual identification and regularity assumptions, the estimator
is consistent if either model is correctly specified. Causal
interpretation also requires well-defined treatments, no unmeasured
confounding, and adequate treatment overlap. Bootstrap samples provide
uncertainty estimates. These synthetic counts do not in general imply an
exactly logistic outcome model; the treatment model is correctly
specified by construction in this example. Chapter 5, “Understanding and
defining causal effects,” discusses marginal and conditional causal
effects (Nguyen et al. 2026).
The outcome formula excludes treatment: atefit() adds
treatment and, by default, its interactions with the outcome covariates.
ps.model includes the treatment on the left. Treatment
labels are ordered as drug0 and drug1. There is no follow-up offset for
this fixed-horizon binary outcome.
outcome_formula <- y ~ age + female + previous_treatment + previous_cost +
  previous_number_relapses
ps_formula <- trt ~ age + previous_treatment
output_atefit <- atefit(
  response = "binary", data = binaryExample,
  cate.model = outcome_formula, ps.model = ps_formula,
  n.boot = 100, seed = 999
)
output_atefit
#> Average treatment effect (risk difference):
#>
#>                   estimate        SE   CI.lower    CI.upper       pvalue
#> risk.difference -0.1079285 0.0196987 -0.1465372 -0.06931972 4.278253e-08
#>
#> Estimated risks:
#>
#>    estimate
#> 1 0.3947549
#> 2 0.5026833
The output reports estimated population-average relapse risks of 0.395 under drug1 and 0.503 under drug0, shown in that order. Their difference (drug1 minus drug0) is -0.108, or -10.8 percentage points. A negative difference favors drug1. The output also reports the bootstrap standard error, a 95% Wald confidence interval, and a two-sided Wald p-value for the risk difference. The causal interpretation depends on the assumptions described above.
Use coef() and confint() to extract the
risk difference and its confidence interval, and plot() to
inspect the bootstrap estimates:
coef(output_atefit)
#> risk.difference
#>      -0.1079285
confint(output_atefit)
#>                      2.5 %      97.5 %
#> risk.difference -0.1465372 -0.06931972
plot(output_atefit, metrics = c("risk0", "risk1", "risk.difference"))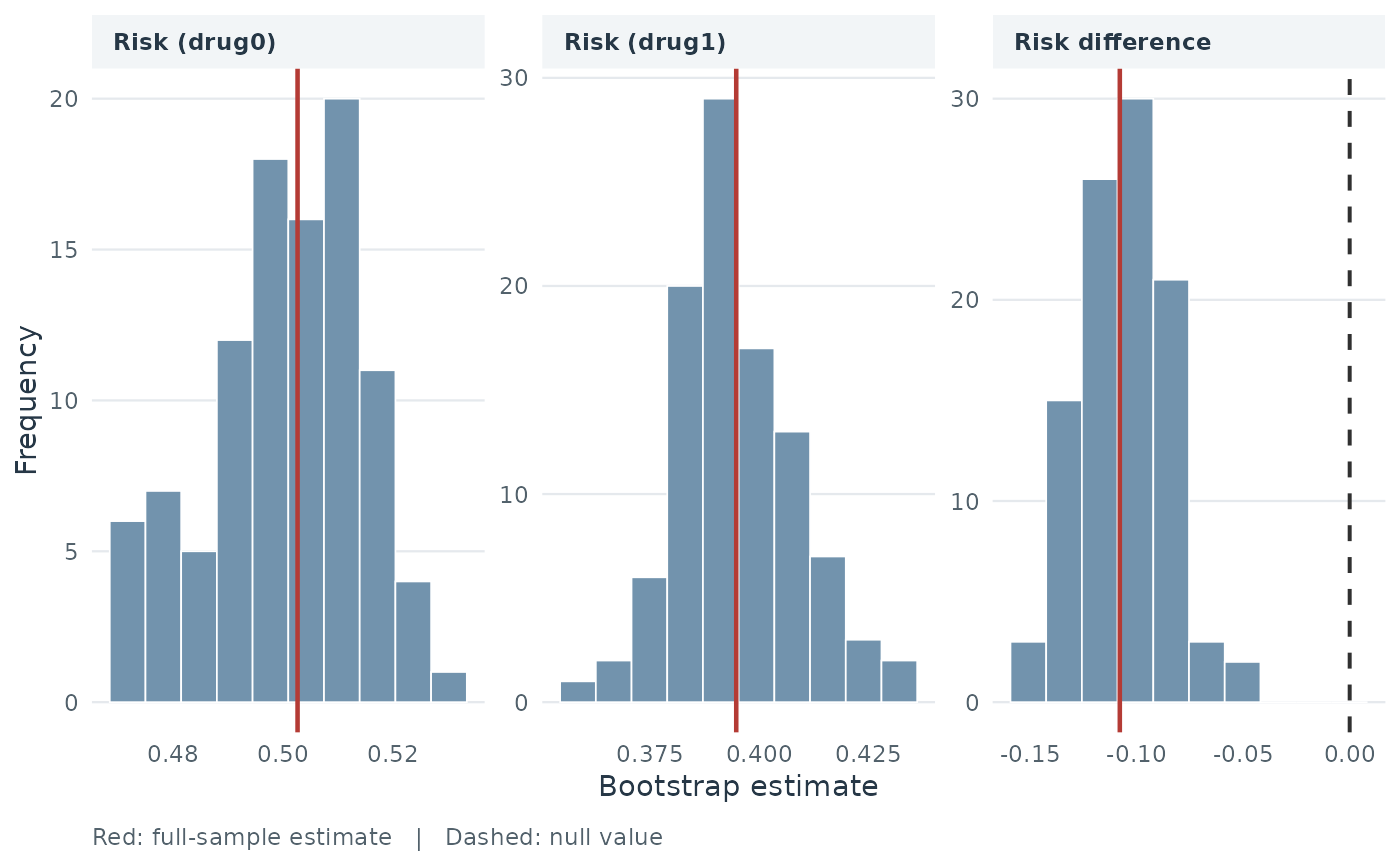
The plot shows bootstrap relapse risks for drug0 (risk0)
and drug1 (risk1), followed by their risk difference. Red
lines mark the full-sample estimates; the dashed line marks zero in the
risk-difference panel. This example uses only 100 bootstrap replicates
to keep the vignette fast; use more for an analysis. If a bootstrap
model fails, the package reports unavailable inference rather than
silently dropping it. Augmented estimates of risk are not constrained to
lie within 0 and 1.
Compare risk differences
All three estimates compare drug1 with drug0 on the same absolute
probability scale. The unadjusted comparison describes the observed
treatment groups. The identity-link binomial estimate uses the outcome
model alone, whereas atefit() adds a propensity-score
correction. Differences between the adjusted estimates can reflect their
different models and assumptions. The unadjusted interval is based on
the two-proportion normal standard error. The binomial model uses a
model-based Wald interval; atefit() uses a Wald interval
based on its bootstrap standard error.
| Estimation method | Interpretation | Risk difference | 95% CI |
|---|---|---|---|
| Unadjusted observed proportions | Unadjusted observed group difference | -0.054 | -0.085 to -0.024 |
| Adjusted binomial identity-link model | Conditional; also marginal under the constant-difference model | -0.097 | -0.131 to -0.064 |
| Doubly robust atefit() | Marginal population-average difference | -0.108 | -0.147 to -0.069 |
The unadjusted difference compares the observed treatment groups; it
is not necessarily a causal marginal effect. The binomial model’s
coefficient is conditional on the included covariates and, because it
assumes the same risk difference for every patient, equals its
model-implied marginal difference. atefit() targets the
population-average difference without requiring a constant conditional
risk difference. Causal interpretations require the assumptions
described above.
A risk difference of -0.10 corresponds to 10 percentage points fewer patients with a relapse under drug1. The intervals describe uncertainty around each estimate; they do not test whether the methods differ from one another.
Estimate CATE scores
CATE scores estimate the difference in relapse probability for
patients with different baseline covariates. The logistic
method fits one logistic model with treatment-covariate interactions;
twoReg cross-fits separate logistic outcome models and a
treatment model, then projects augmented outcomes for each arm onto the
outcome-model design. The difference is a doubly robust linear
projection of the risk difference if either the treatment model or both
outcome models are correct, subject to identification, positivity and
truncation. It need not lie between -1 and 1. The boosting
method fits a Bernoulli gradient boosting model in each treatment arm
and subtracts the predicted relapse probabilities. Five-fold
cross-validation selects the number of trees in each arm;
tree.depth and n.trees.boosting control the
fitted trees. These scores are estimated on the training data; the
subgroup ATEs shown by catefit() use the doubly robust
estimator and the same data used to build the scores, so they may be
optimistic. Chapter 17, “Introduction to methods for personalizing
medicine,” discusses treatment effect heterogeneity and CATE prediction
(Hoogland et al. 2026).
output_catefit <- catefit(
  response = "binary", data = binaryExample,
  score.method = c("logistic", "twoReg", "boosting"),
  cate.model = outcome_formula, ps.model = ps_formula,
  higher.y = FALSE, prop.cutoff = c(0.5, 0.75, 1), seed = 999,
  n.trees.boosting = 100, plot.gbmperf = FALSE, n.cores = 1
)
output_catefit
#> Estimated ATE in the nested subgroups:
#>
#>              prop0.5   prop0.75      prop1
#> boosting -0.1957055 -0.1773050 -0.1079285
#> twoReg   -0.1792806 -0.1474149 -0.1079285
#> logistic -0.1885092 -0.1455664 -0.1079285
#>
#>                               twoReg
#> (Intercept)              -0.16042803
#> age                      -0.00747815
#> female                    0.11779453
#> previous_treatmentdrugB   0.03065470
#> previous_treatmentdrugC   0.02705082
#> previous_cost            -0.01405964
#> previous_number_relapses -0.06104685
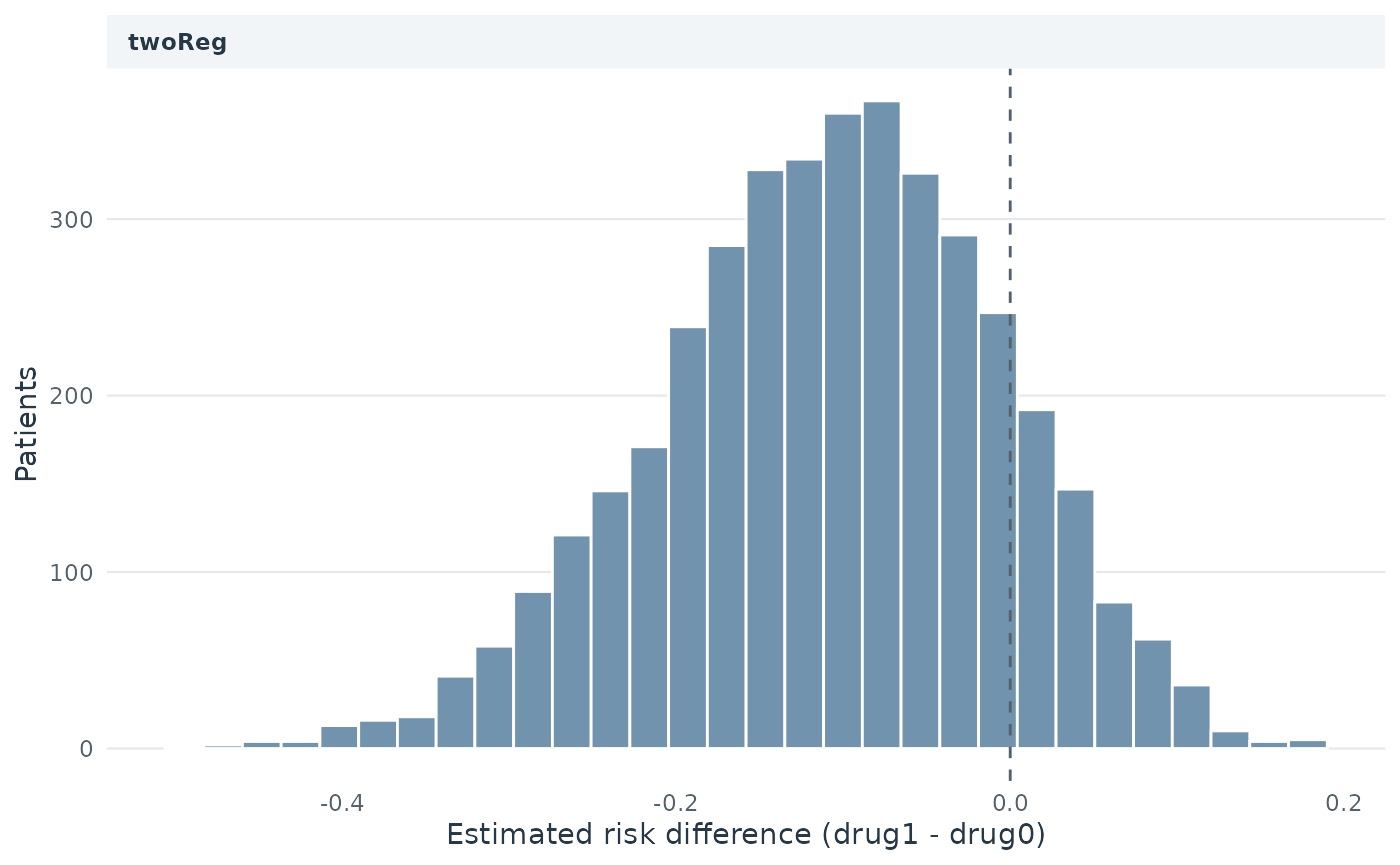
head(output_catefit$score.twoReg)
#>             1             2             3             4             5
#> -1.642382e-01  6.177954e-02 -5.741223e-02  5.561457e-05 -1.572941e-01
#>             6
#>  1.046504e-01
output_catefit$ate.twoReg
#>    prop0.5   prop0.75      prop1
#> -0.1792806 -0.1474149 -0.1079285
output_catefit$ate.boosting
#>    prop0.5   prop0.75      prop1
#> -0.1957055 -0.1773050 -0.1079285
The printed coefficient table and coef(output_catefit)
show the twoReg linear risk-difference score coefficients.
Logistic coefficients are on the log-odds scale and are stored in
output_catefit$fit$logistic; boosting has no linear score
coefficient vector.
For example, prop0.5 is the estimated ATE in the half
with the lowest scores, using a sample quantile cutoff; ties can make
the subgroup larger. higher.y = FALSE selects lower risk
differences as favorable because relapse is an adverse event. For a
desirable binary outcome, use higher.y = TRUE.
Internally validate CATE scores
catecv() repeats treatment-stratified training and
validation splits. It fits the score in each training set, applies it to
the corresponding validation set, and estimates subgroup risk
differences separately in each set. Percentile cutoffs are calculated
within each set without using validation outcomes. We compare
logistic and twoReg on the same splits. The
validation curves and ABC compare how the scores rank patients by
estimated treatment benefit; they do not assess calibration.
diagnostics() reports unavailable subgroup estimates and
subgroup.support records arm sizes. We use 10 repeated
splits and one inner cross-fitting repetition to balance run time and
illustration; more repetitions and independent validation can give a
more reliable assessment. The nested cutoffs select the best-scoring 50%
and the full set, and the mutually exclusive groups split each set in
half. These larger subgroups avoid the rank-deficient fits observed with
smaller groups in this example; check support and model fit when
choosing cutoffs for other data.
binary_cv <- catecv(
  response = "binary", data = binaryExample, score.method = c("logistic", "twoReg"),
  cate.model = outcome_formula, ps.model = ps_formula, higher.y = FALSE,
  prop.cutoff = c(0.5, 1), prop.multi = c(0, 0.5, 1),
  cv.n = 10, B = 1, seed = 102
)
plot(binary_cv, show.abc = FALSE)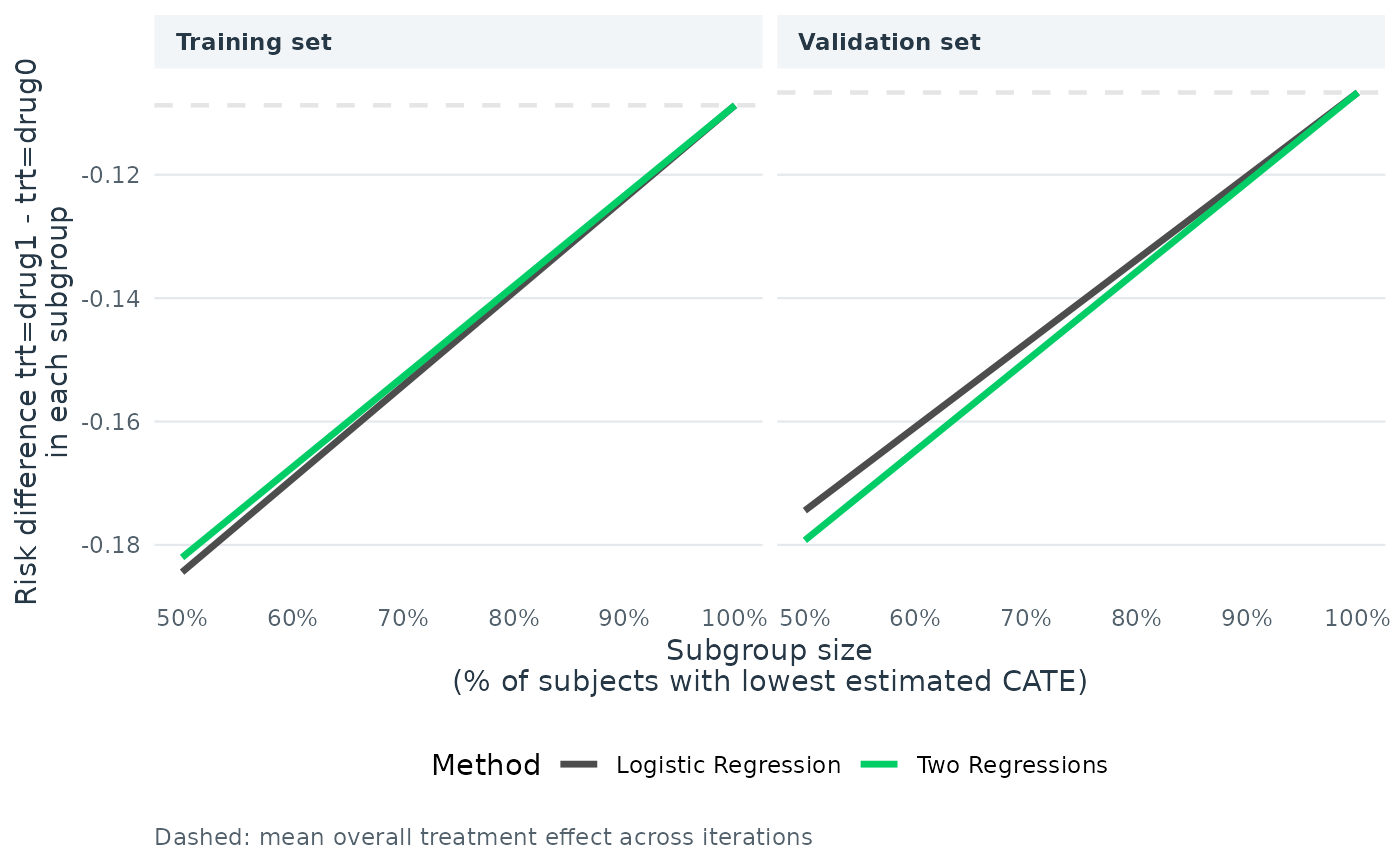
boxplot(binary_cv)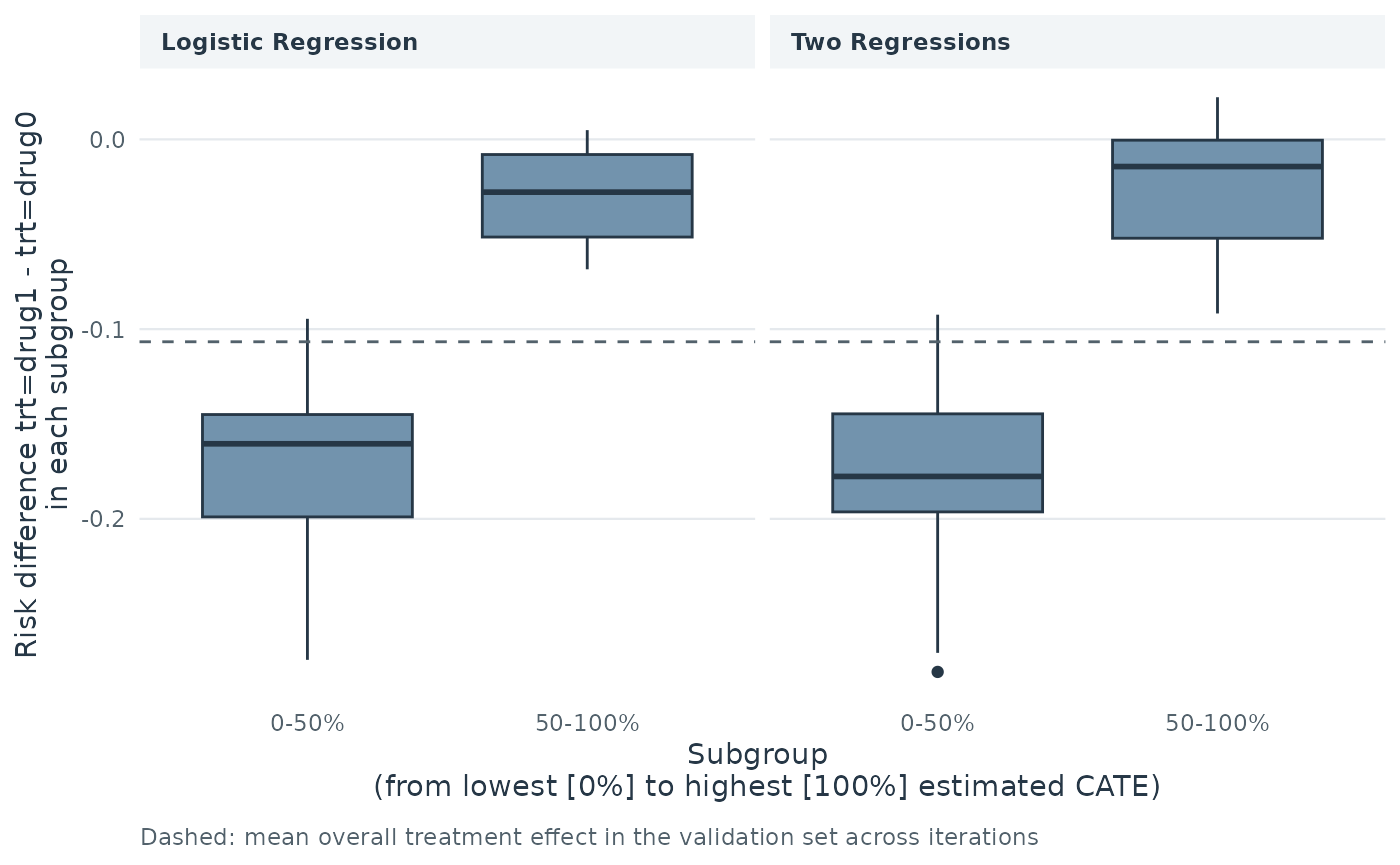
abc(binary_cv)
#>                 cv1        cv2        cv3         cv4        cv5        cv6
#> logistic 0.02997601 0.01402678 0.03633474 0.004732452 0.01140305 0.01547006
#> twoReg   0.02638229 0.01288020 0.03879525 0.007680507 0.01207716 0.01261662
#>                 cv7        cv8        cv9       cv10
#> logistic 0.01857408 0.01841614 0.02342370 0.01266026
#> twoReg   0.01806718 0.01906034 0.02641335 0.01410169
abc(binary_cv, combine = "mean")
#>   logistic     twoReg
#> 0.01850173 0.01880746
The plotted curves use the two requested subgroup proportions.
abc() uses 100 proportions between 0.5 and 1 in each
validation iteration, so its values summarize a finer curve; the plot
omits its separate, coarser ABC annotation.
In this example, the mean validation ABC is 0.0185 for
logistic and 0.0188 for twoReg. These similar
values suggest comparable ranking performance in these splits. The ABC
varies across iterations, and this comparison does not establish that
the methods are equivalent in this population or in other data.
Compare the validation curves and subgroup estimates with the training results, accounting for variation across splits. Lower scores indicate greater predicted benefit in this example. These summaries assess ranking; they do not by themselves establish calibration, clinical usefulness, or a statistically significant difference between subgroup effects. Chapter 19 discusses broader validation (Thao et al. 2026), and Chapter 20 discusses responder diagnostics and treatment-rule interpretation (Jiang et al. 2026).