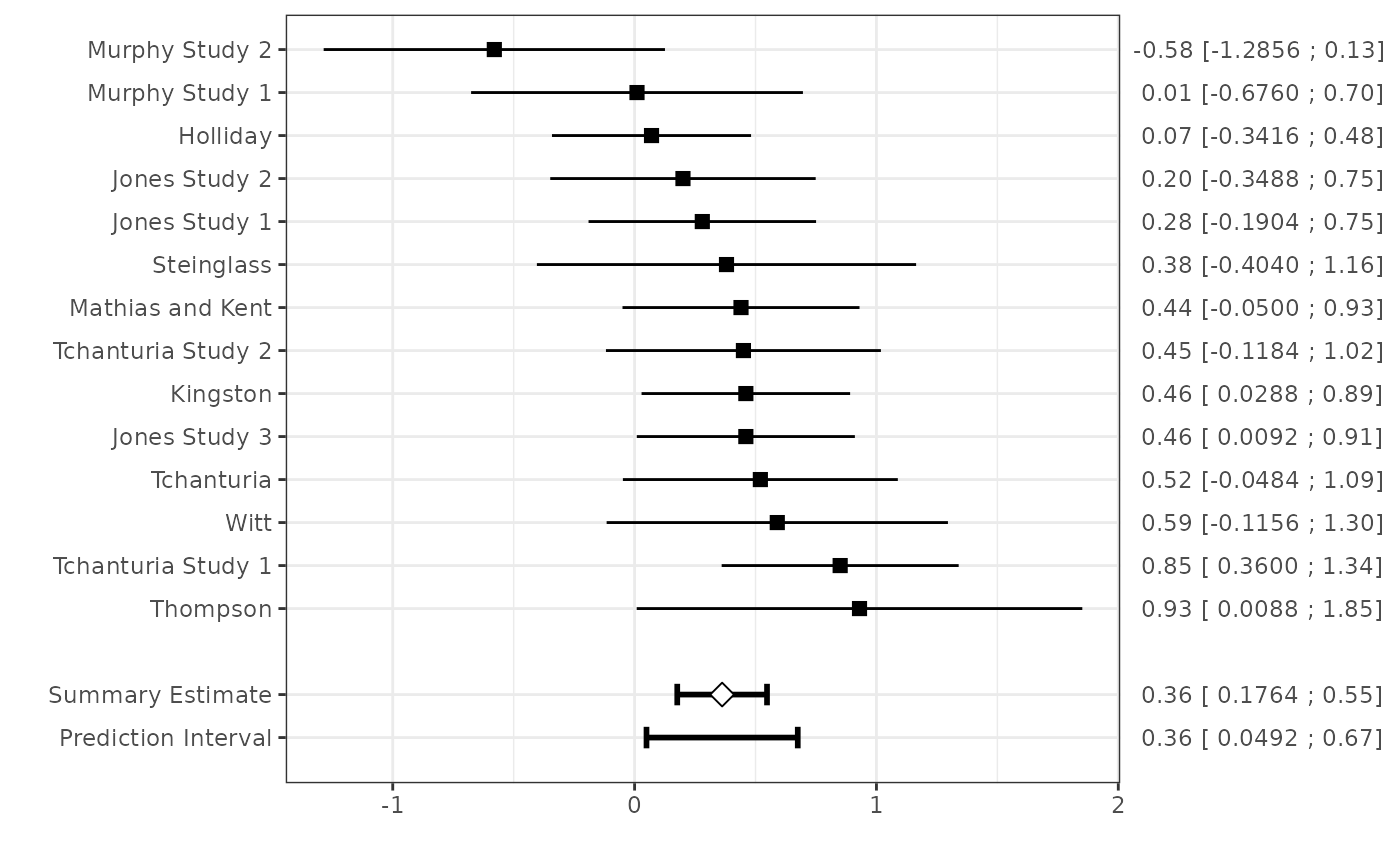
Function to create forest plots for objects of class "uvmeta".
Usage
# S3 method for class 'uvmeta'
plot(x, sort = "asc", ...)
Arguments
- x
An object of class
"uvmeta"- sort
By default, studies are ordered by ascending effect size (
sort="asc"). For study ordering by descending effect size, choosesort="desc". For any other value, study ordering is ignored.- ...
Additional arguments which are passed to forest.
Details
The forest plot shows the performance estimates of each validation with corresponding confidence intervals. A polygon is added to the bottom of the forest plot, showing the summary estimate based on the model. A 95% prediction interval is added by default for random-effects models, the dotted line indicates its (approximate) bounds
Note
Full lines indicate confidence intervals or credibility intervals (in case of a Bayesian meta-analysis). Dashed lines indicate prediction intervals. The width of all intervals is defined by the significance level chosen during meta-analysis.

