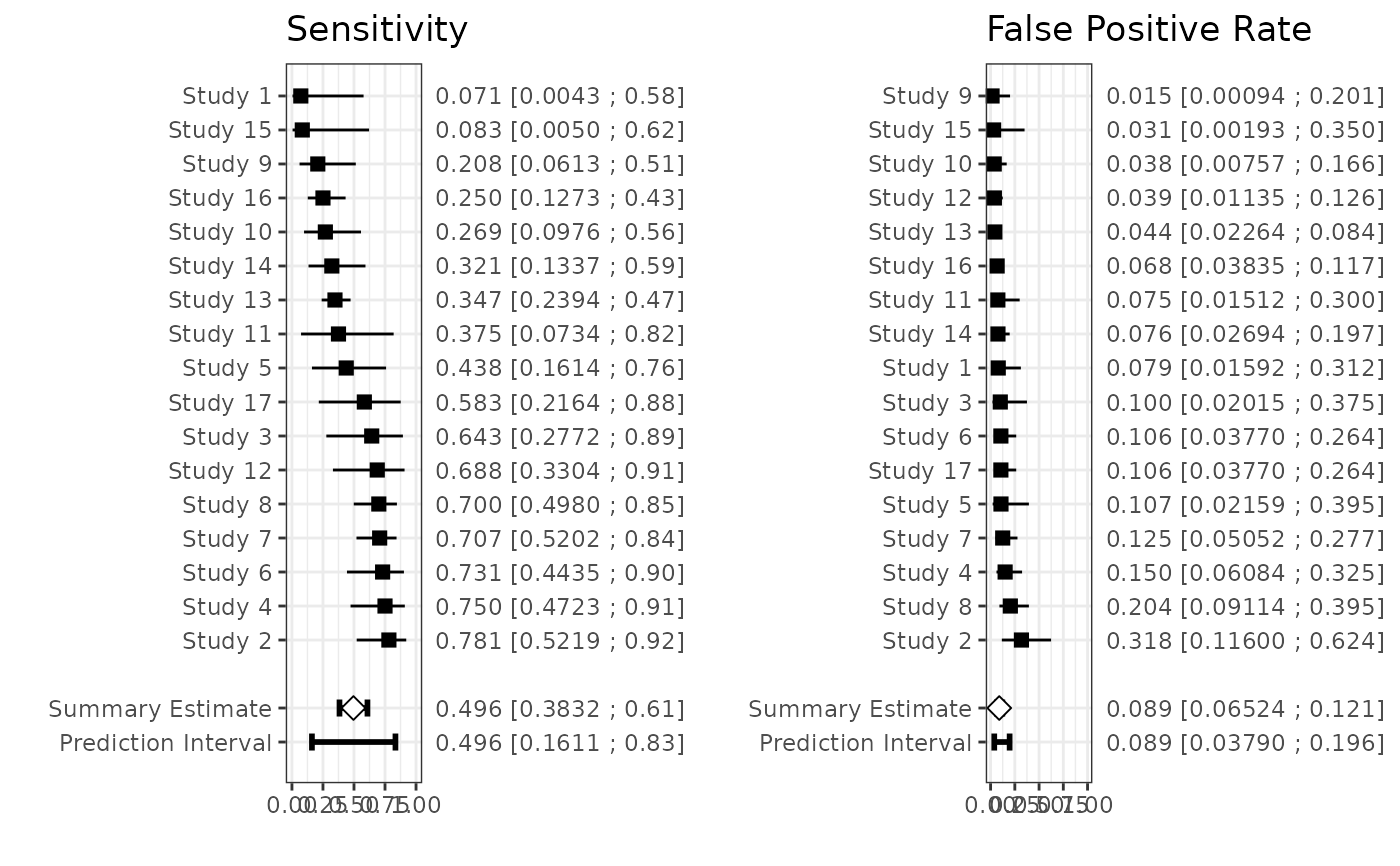
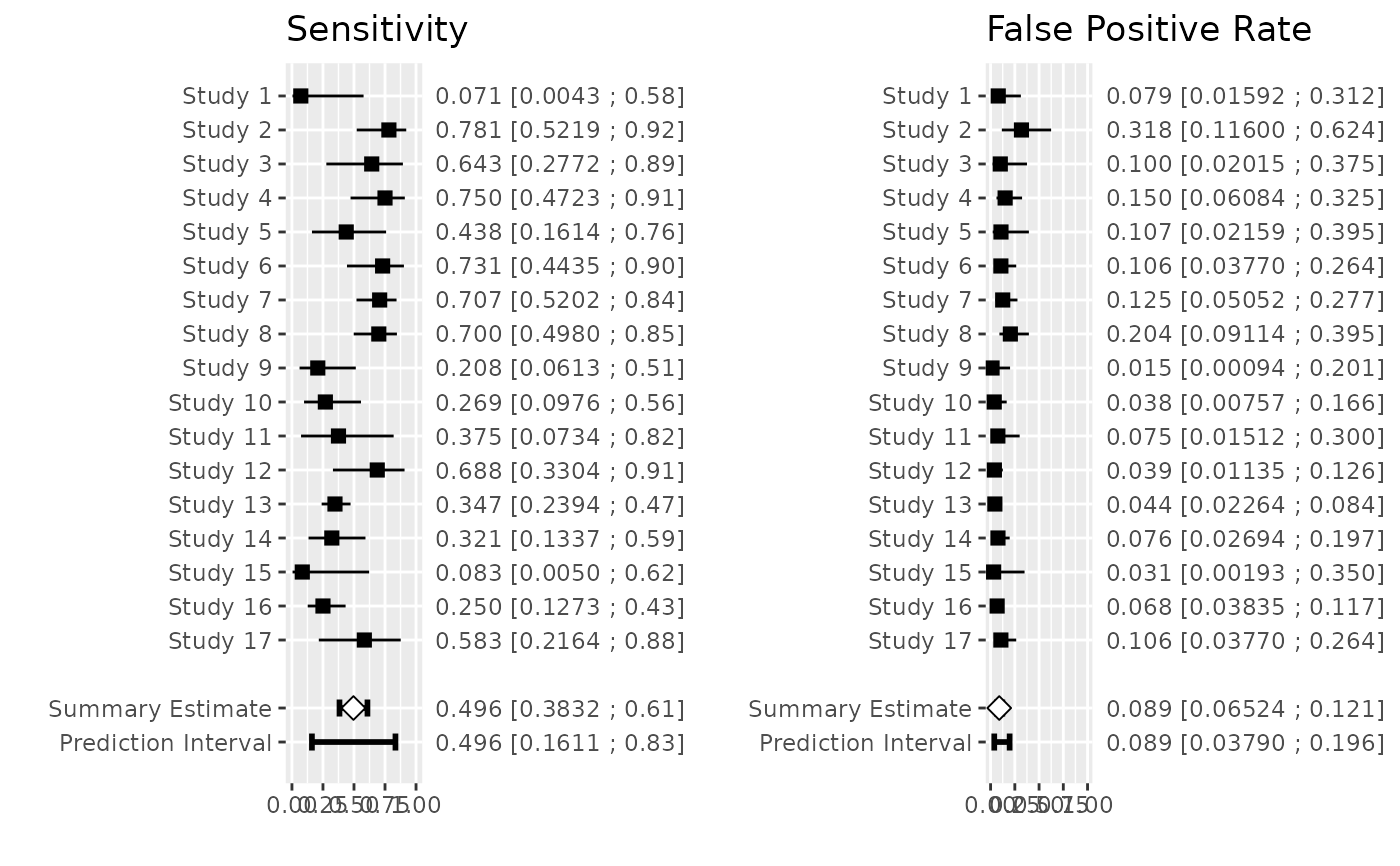
Generates a forest plot for each outcome of the bivariate meta-analysis.
Usage
# S3 method for class 'riley'
plot(x, title, sort = "asc", xlim, refline, ...)
Arguments
- x
An object of class
riley- title
Title of the forest plot
- sort
By default, studies are ordered by ascending effect size (
sort="asc"). For study ordering by descending effect size, choosesort="desc". For any other value, study ordering is ignored.- xlim
The
xlimits(x1, x2)of the forest plot- refline
Optional numeric specifying a reference line
- ...
Additional parameters for generating forest plots